Explore
Reference Proteome Tree
Click on each node to expand the tree and explore the available reference proteome comparisons.
Guide
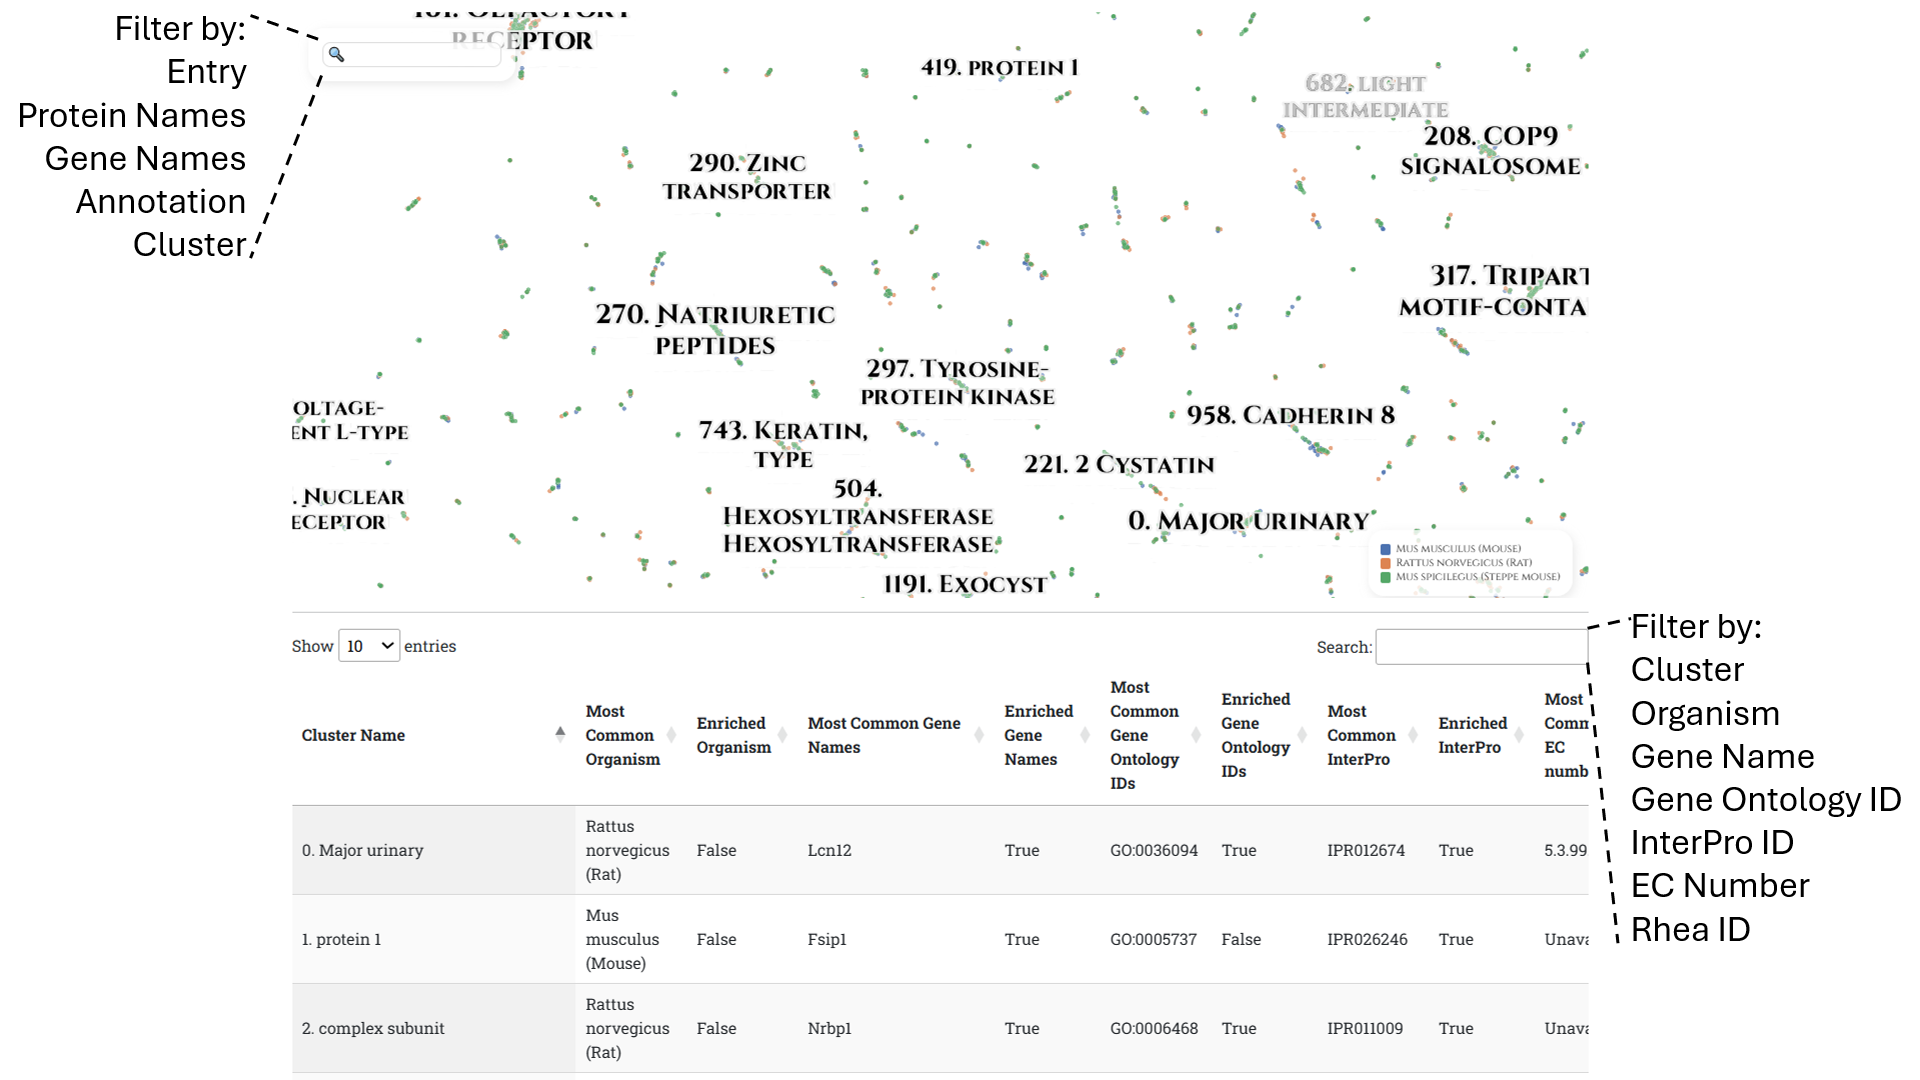
Each comparison page contains a list of the available species at the top, separated by “genus”, a PLVis projection of the proteomes, and an enrichment analysis table highlighting overrepresented annotations.
PLVis projection:
Each visualization is colored according to the organisms. A search bar located in the upper left corner of each projection allows users to dynamically filter the data by entering keywords. Users can filter by UniProt Entry ID, Protein Names, Gene Name, Annotation Score, and cluster to highlight specific proteins of interest.
For example: "cluster: 236", "annotation: 1.0", "lymphocyte antigen".
Enrichment analysis table
An enrichment table is located below the visualization to aid users in finding functionally important clusters. The information shown in each column represents the most common entry for each category and whether or not that entry is hypergeometrically enriched in the cluster. A search bar is located in the upper right corner of the table to dynamically filter by Gene Name, InterPro ID, Gene Ontology ID, EC Number, Rhea ID and cluster.
For example: "ubiquitin-protein", "IPR050409", "Dtx3".